|
<< Click to Display Table of Contents >> Summary |
  
|
|
<< Click to Display Table of Contents >> Summary |
|
The Summary tab is the first section you will see when you log in to your reporting tool. It provides a dashboard view of all the statistics about your properties and user activity for these properties.
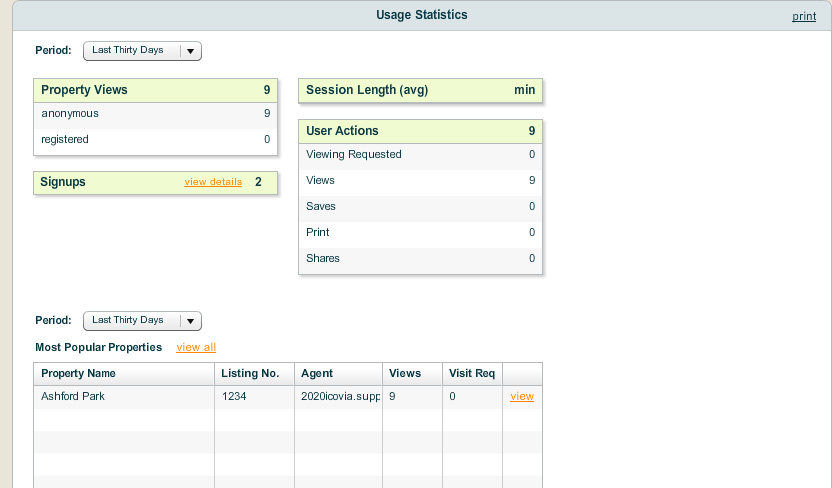
The left side of the screen is the User Activity section which provides a summary of user activity. The first graph shows you a quick summary of user activity over all time. The all time user activity graph is color coded and displays the number of times your properties were viewed, the number of times a property or plan was shared or printed, the number of times properties were saved, the number of users registered, the number of viewings scheduled.
The second graph displayed is the user activity in the last 30 days. This again offers a quick summary but here the statistics are limited to user activity in the last 30 days. This section is very useful to gauge how effective your listings are currently and whether you need to make any changes to generate more user interest.
| • | Click on the All Time or Last 30 Days links to view a list of leads/contacts who registered along with their contact details |
| • | The View All Contacts button below the graphs offers quick navigation to view a list of all the leads generated from your listing. This is a list of all the people who have registered, have expressed an interest in a property or have requested a viewing. |
The right side of the screen provides you a quick summary of your Top Properties by providing a list of the five properties that have been viewed the most times and five properties for which the most number of viewings have been requested.
| • | Click on the View All Properties button at the bottom to view a list of all properties with their statistics. |
| • | Click on a Property Name to view the statistics for that property like the number of times the property has been viewed, the number of times it was saved or printed, the number of times it was printed and the number of times a visit was requested. A list of all the contacts who saved, printed, shared or requested a visit is also displayed on this page. The list can be sorted based on a date range, viewed as a report or exported to an external file outside Icovia. |